Deep Dive into Logistic Regression: Analyzing Handwritten Digits
A project implementing and analyzing both binary and multinomial logistic regression models to classify handwritten digits from the MNIST dataset
Using: Logistic Regression, Python, NumPy, Matplotlib
Project Overview
In this project, I explore the application of logistic regression in machine learning through two distinct approaches: binary logistic regression and multinomial logistic regression. The primary goal is to classify handwritten digits from the MNIST dataset, which consists of images of size 28x28 pixels in grayscale.
Implementation Details
- Languages & Libraries: Python, NumPy, Matplotlib for data manipulation and visualization.
- Data Preprocessing: Handling grayscale image data, converting them into feature vectors.
- Model Training: Applying Stochastic Gradient Descent (SGD) for optimization.
Binary Logistic Regression
- Objective: Classify MNIST digits into two classes using image pixels as features.
-
Approach: Implement
model.BinaryLogisticRegressionModelto distinguish between two specific digit classes (e.g., “7” vs. “9”), represented as “0” and “1”. - Analysis: Generate and analyze accuracy curves, confusion matrix, model weights, and specific erroneous predictions to understand the model’s performance and limitations.
Insights and Analysis
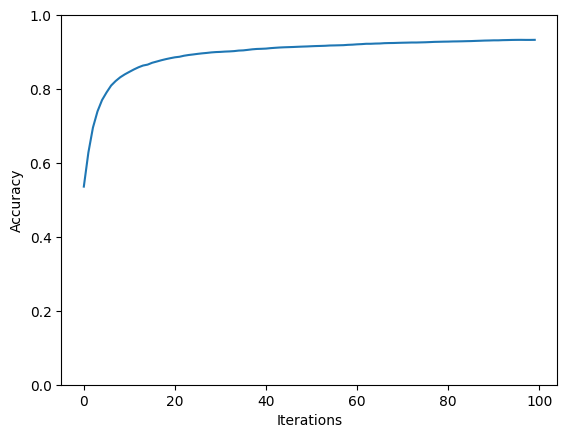
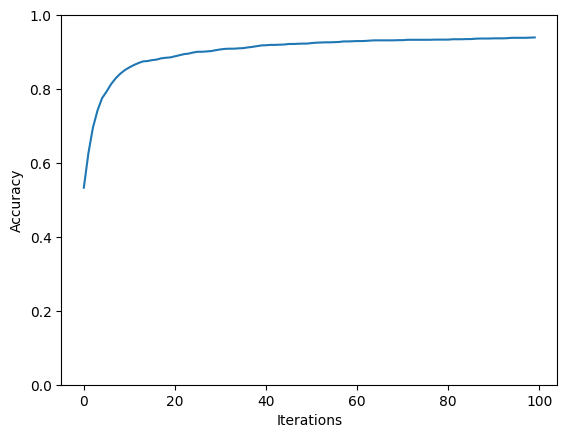
Accuracy Curves
Confusion Matrix
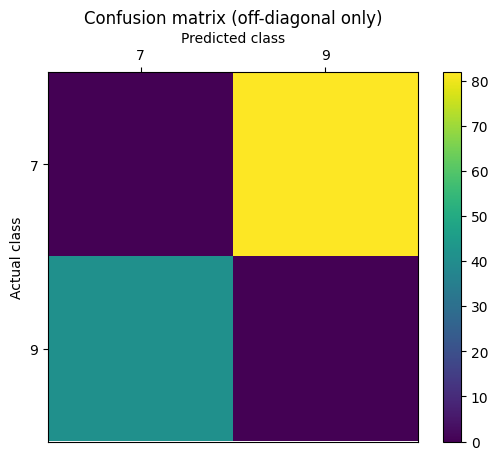
Accuracy: 93.9617% (1914 out of 2037)
Confusion Matrix:
| 7 | 9 | |
|---|---|---|
| 7 | 946 | 82 |
| 9 | 41 | 968 |
Non-Bias Term Weights
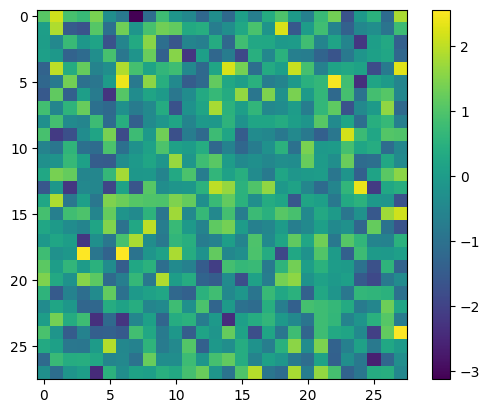
- The color bar on the right indicates the scale of the weights. In this heatmap, colors closer to the top of the color bar (yellows and greens) represent higher weights, while colors towards the bottom (blues and purples) represent lower weights. Yellow indicates strong positive weights, and purple indicates strong negative weights.
- Positive Weights (Yellow): These areas are where the pixel values significantly contribute to the model predicting the digit as a 7. It means that for pixels in these regions, the presence of a certain intensity (white since it’s a typical black-on-white handwriting dataset) will push the model towards identifying a 7.
- Negative Weights (Purple): These areas are where the pixel values contribute to the model predicting the digit as a 9. It implies that for these pixels, a certain intensity (black) will push the model towards identifying a 9.
- Neutral Weights (Green/Blue): These pixels don’t have much influence on the differentiation between 7 and 9, meaning that their values do not significantly sway the model towards either digit.
- The model uses these weights to decide whether a new, unseen image of a digit is more likely to be a 7 or a 9. When it ‘sees’ an image, it will multiply the pixel values by these weights to reach a decision.
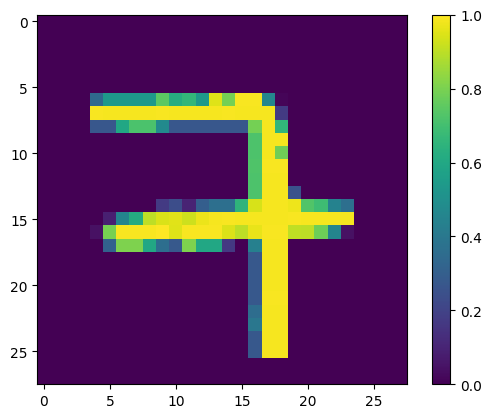
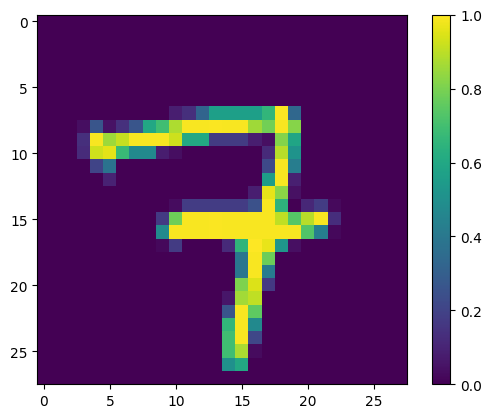
Analysis of Erroneous Predictions
|
|
|
|
|
|
|
|
|
|
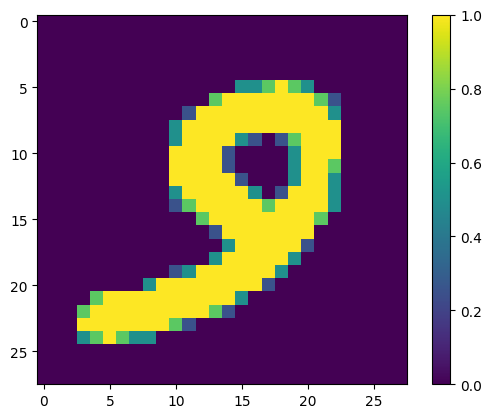
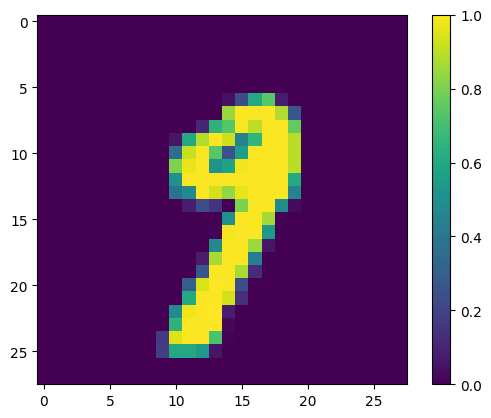
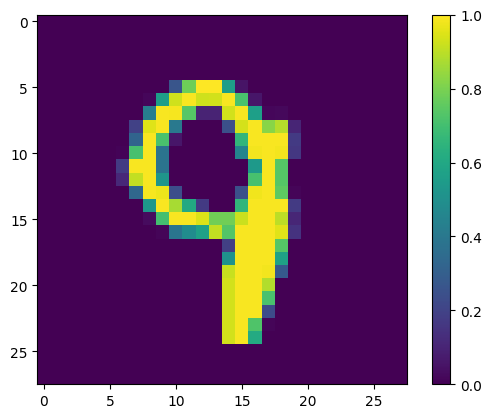
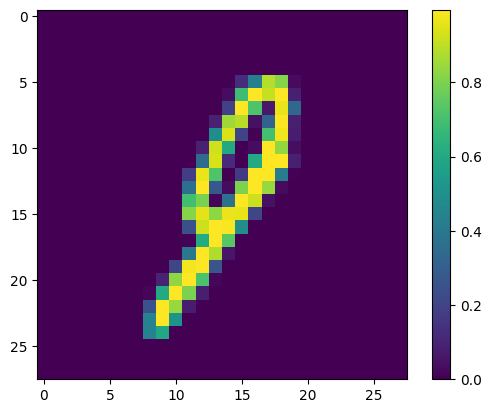
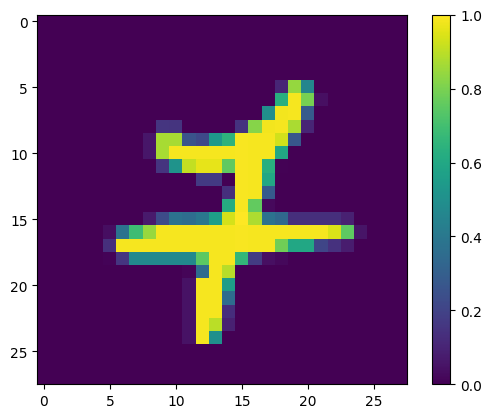
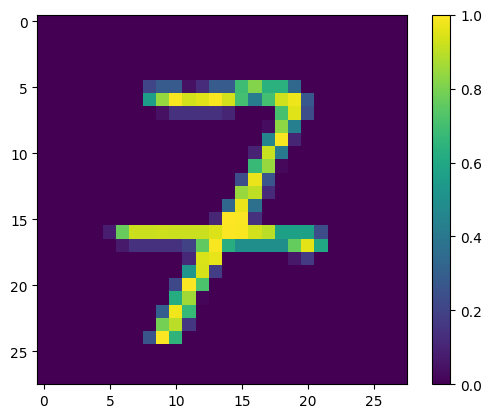
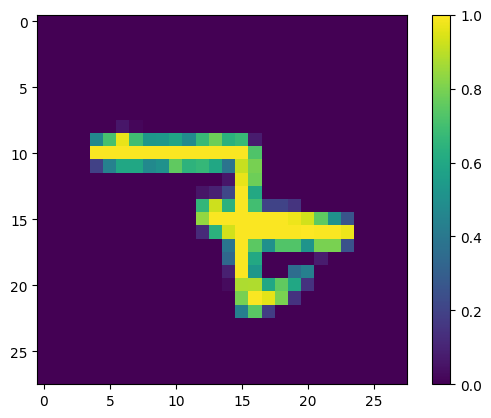
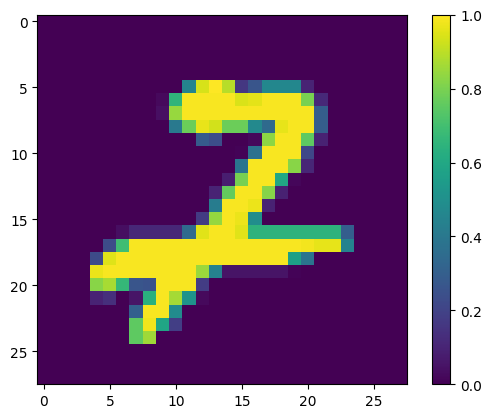
Some potential reasons why the model made errors on these cases/what it failed to capture:
- Ambiguity in Digit Formation: If the shapes are not clearly defined or have ambiguous features that could belong to multiple digits, the model might be confused. For example, if a ‘9’ is written with a very small loop, it might resemble a ‘7’.
- Noise and Distortions: Variability in writing style, such as slants, loops, or breaks in the strokes, can introduce noise that the model fails to handle well.
- Model’s Feature Sensitivity: The model may not be sensitive to certain features that differentiate the digits. For example, the intersection in the ‘7’ or the loop in the ‘9’.
Additional features that may help the model make correct predictions on these error cases:
- Contextual Features: Incorporating context, like the relative position of loops and lines, could help distinguish between similar digits.
- Stroke Analysis: Analyzing the order and direction of strokes could provide more insight into the intended digit.
- Structural Decomposition: Breaking down the digit into constituent parts and analyzing the presence or absence of these parts (like the crossbar in a ‘7’ or the loop in a ‘9’).
- Convolutional Features: Using Convolutional Neural Networks (CNNs) to capture spatial hierarchies in the data that simple weight matrices might miss.
- Data Augmentation: Increasing the diversity of the training data by introducing variations in digit representation, such as rotations, scaling, and noise.
- Complexity Control: Applying regularization techniques to prevent overfitting to the training data.
- Error Analysis: Conducting a thorough error analysis to understand the specific cases where the model fails and adapting the training strategy accordingly.
- Ensemble Methods: Using ensemble methods that combine the predictions of multiple models to improve accuracy.
- Human-like Feature Extraction: Incorporating features that mimic human visual perception, such as recognizing overall shape patterns before focusing on details.
Multinomial Logistic Regression
- Objective: Extend classification to all 10 digit classes in the MNIST dataset.
-
Approach: Utilize
model.MultiLogisticRegressionModelfor a more comprehensive classification covering all digits from “0” to “9”. - Analysis: Similar to the binary case, this section involves plotting training and test accuracy curves, confusion matrices, and an examination of the learned weights for all digit classes.
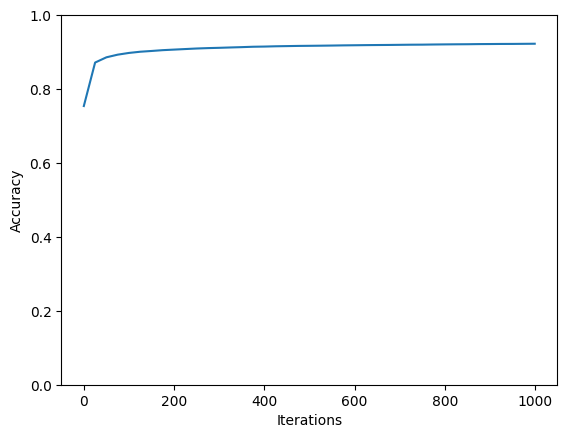
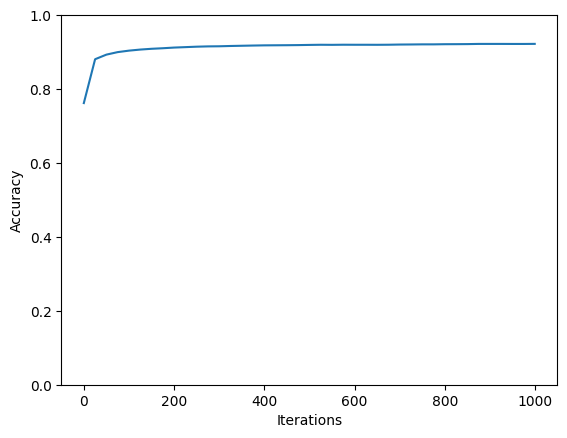
- Performance Optimization: Due to the larger scale of data (60K training images and 10K test images), strategies such as training on a fraction of the data and using fewer iterations during development and debugging are employed for efficient performance without compromising accuracy.
Insights and Analysis
Accuracy Curves
Confusion Matrix
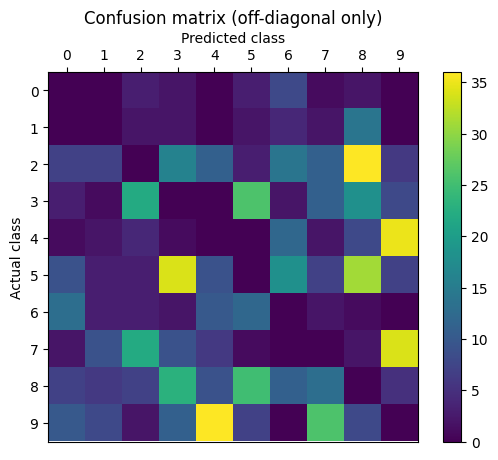
Accuracy: 92.22 % ( 9222 out of 10000 )
Confusion matrix:
0 1 2 3 4 5 6 7 8 9
0 [961, 0, 3, 2, 0, 3, 8, 1, 2, 0]
1 [0, 1109, 2, 2, 0, 2, 4, 2, 14, 0]
2 [7, 7, 921, 16, 11, 3, 14, 11, 36, 6]
3 [3, 1, 22, 919, 0, 26, 2, 11, 18, 8]
4 [1, 2, 4, 1, 917, 0, 12, 2, 8, 35]
5 [9, 3, 3, 34, 9, 771, 18, 7, 31, 7]
6 [13, 3, 3, 2, 10, 12, 912, 2, 1, 0]
7 [2, 9, 22, 9, 6, 1, 0, 943, 2, 34]
8 [7, 6, 7, 23, 9, 25, 11, 13, 868, 5]
9 [10, 8, 2, 11, 36, 7, 0, 26, 8, 901]